HERA raises guaranteed-supply electricity prices: how much can on-site solar protect your business?
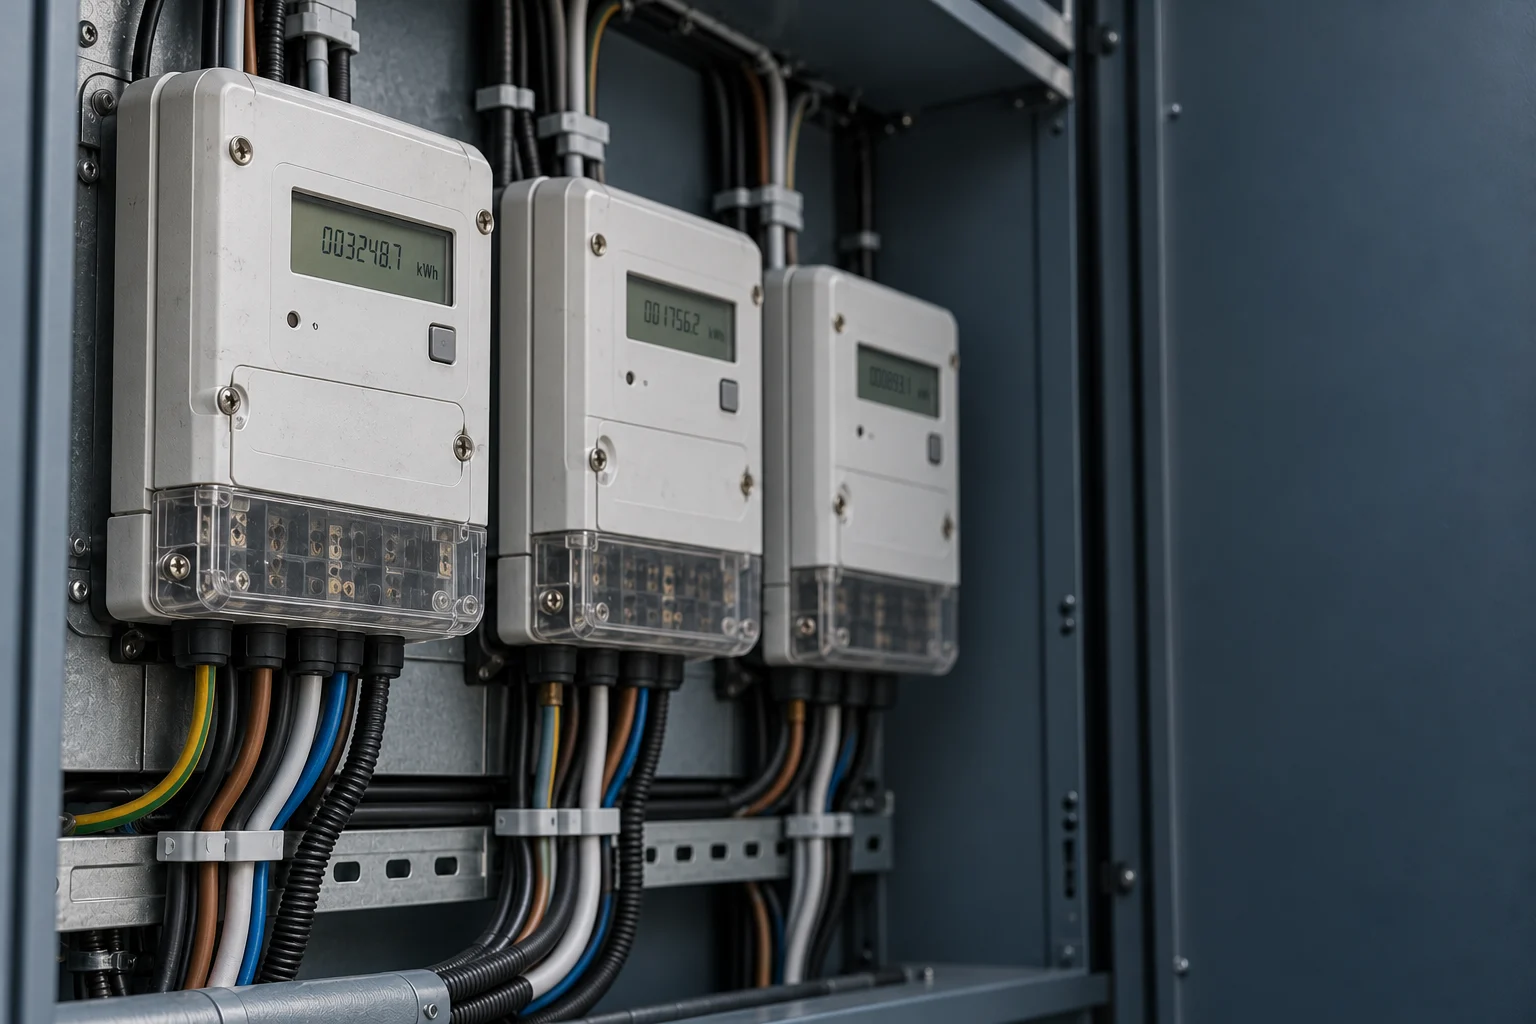
Five cents per kilowatt-hour may sound small. On annual purchases of 500,000 kWh, it means a €25,000 difference. Generating and using part of that electricity on site changes your exposure to prices. By how much? HERA’s latest decision is a reason to distinguish the actual scope of the increase from a question relevant to every business site: what is on-site generation worth during your operating hours?
The opening figures are an illustrative calculation: 500,000 × €0.05 = €25,000. They are not a prediction of an increase in your bill. That assessment starts with your supply contract.
What changes, and who is affected?
HERA has adopted new guaranteed-supply tariffs effective from 1 November 2026. They concern business customers without a contract with a market supplier who are supplied by HEP ELEKTRA. This is not a general price increase for all businesses.
Because of government protection measures, HERA explains that the increase affects guaranteed-supply business customers consuming more than 250,000 kWh in six months, for consumption above the protected threshold. In August 2026, full guaranteed-supply prices on consumption above that threshold applied at 1,311 billing metering points, or 0.56% of business-category metering points in Croatia. These are metering points, not a count of companies.
A headline percentage increase in a particular tariff is therefore not the percentage increase in every company’s total bill. Source: HERA’s explanation of 14 October 2026, in Croatian. Official tariff decision: NN 117/2026.
What should you check on your bill?
Before assessing a PV system, check your supplier, whether you have a market contract, how prices are set and when the contract expires. If you use guaranteed supply, exploring a market supply contract is an immediate step; a PV installation has its own preparation and delivery timeline.
Separate electricity consumption, energy prices, network charges and other fees. Dividing your total bill by consumption does not automatically give the value of each self-generated kilowatt-hour: some charges do not fall proportionately when grid purchases decline.
What do the new tariffs actually say?
The official decision for November 2026 distinguishes the first two months of using guaranteed supply from the period after that. This refers to the duration of guaranteed supply, rather than automatically meaning November and December for every customer.
| Voltage level / tariff model | First two months | After two months |
|---|---|---|
| Medium voltage, higher and lower rates | 0.287467 | 0.319088 |
| Low voltage, Crveni, higher and lower rates | 0.283360 | 0.314530 |
| Low voltage, Bijeli, higher rate | 0.251961 | 0.279677 |
| Low voltage, Bijeli, lower rate | 0.169558 | 0.188209 |
The table shows active-energy rates, not the final bill price including network charges, other fees and taxes. The decision separately lists a supply fee of €4.65 per month. Protected consumption must be considered separately; these rates do not automatically apply to every kilowatt-hour purchased. Source: NN 117/2026, decision 1401, November 2026 tables, in Croatian.
A November tariff is not a guaranteed annual price. HERA explains that the methodology allows changes as frequently as monthly. A PV investment assessment should therefore not assume that one current tariff will remain in place for years. Source: HERA’s explanation of the methodology, in Croatian.
The same price increase, a smaller impact: €25,000 or €17,500?
Now separate the official tariffs from an illustrative sensitivity scenario. A business uses 500,000 kWh annually. If it directly consumes 150,000 kWh of solar electricity, grid purchases fall to 350,000 kWh. Assume comparable purchased-energy prices of €0.15/kWh before a change and €0.20/kWh afterwards, excluding VAT and equal across all hours considered.
| Measure | Without PV | With on-site solar consumption |
|---|---|---|
| Total site demand | 500,000 kWh | 500,000 kWh |
| Solar electricity consumed directly | 0 kWh | 150,000 kWh |
| Grid purchases | 500,000 kWh | 350,000 kWh |
| Energy cost at €0.15/kWh | €75,000 | €52,500 |
| Energy cost at €0.20/kWh | €100,000 | €70,000 |
| Increase in annual cost | €25,000 | €17,500 |
Calculation: 150,000 kWh × (€0.20 − €0.15)/kWh = €7,500. The percentage concerns the increase in purchased-energy cost, not the total bill or investment return.
Calculation limits: €0.15 and €0.20/kWh are assumptions, not HERA’s old and new tariffs. This is not a simulation of the 250,000 kWh six-month protection threshold. Such a simulation requires quantities and applicable prices within each billing period. The 150,000 kWh of direct consumption is an assumed input, not a PV yield forecast.
The table isolates the effect of a change in purchase prices. It excludes capital expenditure, maintenance, financing, network charges, taxes and exports. The €7,500 difference forms part of the change in the value of the same solar electricity; it must not be counted again as a separate benefit.
Why does your result depend on operating hours?
PV reduces purchases when its output can be used on site. Night shifts, weekends and seasonal shutdowns change that relationship. Annual production cannot replace a comparison of consumption and generation over time.
The European Commission’s PVGIS provides generation estimates based on location and configuration, including hourly data. These should be combined with site consumption data and checks of the roof, shading and grid connection requirements. Source: European Commission, PVGIS user manual.
Do you need a battery? First check what you can shift without one.
Before adding equipment, assess whether some demand can be scheduled during solar production hours while respecting operational and safety needs. Charging company vehicles or running certain auxiliary processes may be worth analysing. Feasibility and benefits must be established using actual data.
A battery can move some surplus energy to later consumption, with losses and costs of its own. Compare its incremental value with the same project without storage. Backup power during an outage requires an appropriate system design; installing PV or a battery does not automatically provide it. Read more: on-site generation, business risk and batteries.
What should you check before investing?
- Consumption: the last 12 months of bills, interval data if available, shifts and seasonal patterns.
- Supply terms: your contract, pricing method, expiry date and export purchase terms.
- Site and connection: available space, roof condition and structural capacity, shading and connection requirements.
- Future operations: new machinery, EV chargers, cooling or shift changes.
- Alternative scenarios: lower electricity prices, less on-site consumption or a change in investment costs.
Ask a simple question: does the project still make sense if electricity becomes cheaper? If the business case depends entirely on an exceptionally high purchase price, you should know that before committing.
- How much generated electricity will I actually use on site, and how much will be exported?
- Which bill components are treated as avoided costs, and why?
- How does the result change if electricity prices fall or operating shifts change?
You do not need to know the capacity of your future PV system to start. Bring your bill, contract and operating schedule. They help establish whether a detailed assessment is worthwhile.
Your roof has an area. Your consumption helps determine what that area can be worth. The current price increase can start the conversation; the decision should rest on your company’s own business case.
Official sources are linked alongside the relevant claims. Regulatory information checked on 18 October 2026; its currency must be checked again before later publication or updates. EMISSIO TRADE’s illustrative calculation explains a method and is not an actual project result or a savings promise.