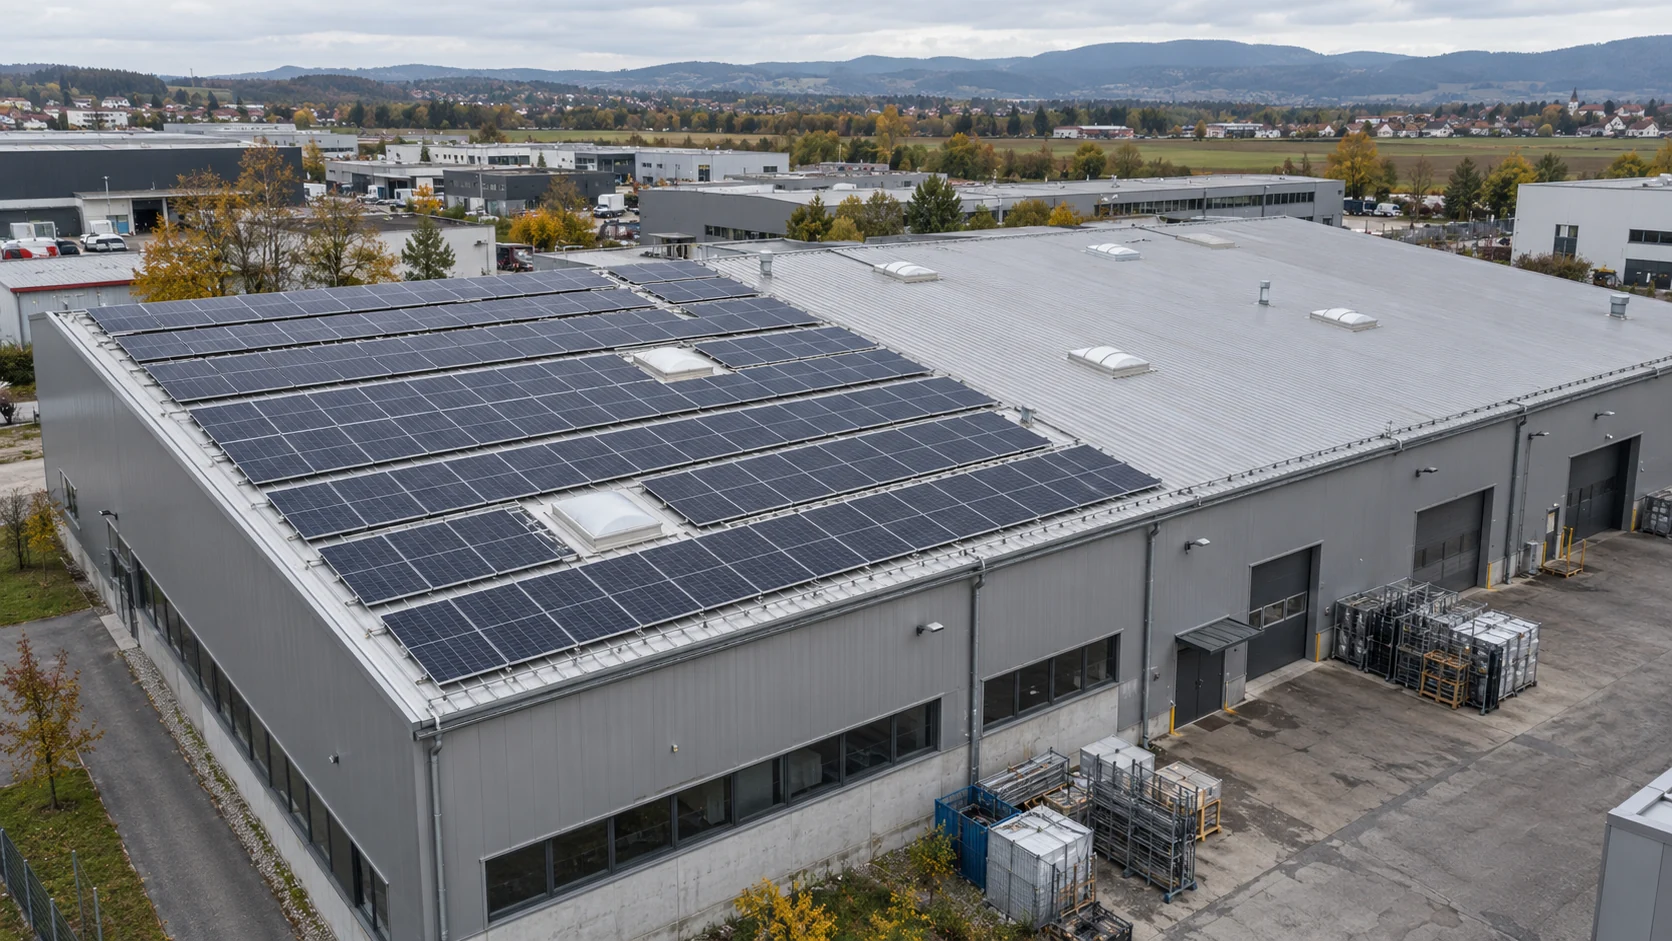
A 2019 NREL model for a public building in Orlando selected a 24 kW installation against an estimated maximum of 100 kW. This is an analytical result, not a report of a completed installation. [10, pp. 6 and 22]
For a business considering solar, this raises an important question: how was the capacity in the proposal selected? A verifiable answer needs to connect consumption, generation, site conditions and the financial assessment.
What does an annual electricity bill leave out?
Annual totals do not show how closely generation and consumption overlap throughout the day. A time-based analysis distinguishes electricity used directly on site, electricity exported and electricity purchased from the grid. IEA PVPS discusses self-consumption in real time or over short intervals, giving 15 minutes as an example. [2, pp. 4 and 5]
When preparing a project, collect available interval data alongside bills and explain shifts, non-working days and shutdowns. HEP ODS publishes information on access to metering data; availability for the specific metering point should be checked with the operator. [6]
kWp, kW and kWh: what is being compared?
kWp describes the rated peak power of photovoltaic modules under standard test conditions. The JRC specifies irradiance of 1,000 W/m² in the plane of the modules and a module temperature of 25 °C. Rated capacity therefore does not represent constant output during operation. [1, section 4.1]
HEP ODS technical documentation distinguishes power in kW from annual energy in kWh. It also requests installed AC capacity separately from grid import and export connection capacities. [4, p. 2]
PVGIS estimates generation from the location and system characteristics. Outputs include annual, monthly and hourly data, as well as year-to-year variability. When comparing estimates, check orientation, tilt, technology and assumed losses. [1, sections 4.1, 4.2 and 9]
Which site and consumption data support the proposed capacity, and can other feasible sizes be compared using the same assumptions?
Two percentages that should not be confused
Self-consumption describes the use of solar generation on site; self-sufficiency describes its contribution to the site's total electricity demand. IEA PVPS emphasises the distinction between these indicators. [2, p. 5]
Direct self-consumption ratio
Solar electricity used directly on site
÷ total solar generation × 100%
How much of our generation do we use immediately?
Share of demand covered
Solar electricity used directly on site
÷ total business electricity consumption × 100%
How much of our demand does solar supply directly?
The ratios refer to the same period and a system without battery storage. Ratio definitions: [9, section 2.1].
Request both indicators and the corresponding energy quantities when reviewing a proposal. The proportion of solar generation used on site does not, on its own, show how much electricity the business still needs to purchase from the grid.
Estimated maximum: 100 kW. Economic selection: 24 kW.
The analysis provides the following comparison for two fire stations in Orlando:
| Facility | Annual consumption | PV capacity limit used in the model | Capacity selected by the model |
|---|---|---|---|
| Fire Station #16 | 140,387 kWh | 100 kW-DC | 24 kW-DC |
| Fire Station #17 | 147,514 kWh | 103 kW-DC | 68 kW-DC |
Source: [10, pp. 6 and 22]. Annual consumption is similar, yet the model selects 24 and 68 kW-DC respectively. Annual totals alone therefore do not determine capacity: the analysis combines consumption over time, tariffs and costs. The contribution of any single factor cannot be isolated from these results. The model uses local financial assumptions and a 20-year analysis period.
This is a preliminary analysis of US public buildings, not Croatian businesses. NREL states that it did not independently validate the site inputs and that the results should not be the sole basis for an investment decision. The figures illustrate the method; they are not capacity recommendations for another site. [10, pp. 2, 4 and 12]
How do data lead to a capacity recommendation?
Techno-economic optimisation combines interval consumption, capital and operating costs, tariffs and financial parameters. REopt lists technology sizes, operating schedules, life-cycle cost and net present value among its outputs. This provides a methodological basis for comparison, rather than a completed assessment of a Croatian site. [8]
A useful proposal comparison follows three steps:
- Identify feasible options. Roof suitability and grid-connection documentation establish the options requiring technical assessment. [3] [7]
- Compare generation against the same consumption. For each capacity considered, show on-site use and exports, with the time-based inputs clearly identified. [2, pp. 4 and 5]
- Compare the overall economics. Show investment, operating costs and the outcome over the selected analysis period. Financial inputs should be explicit. [8]
The key question about additional panels is how they change the result for the whole project. Ask the supplier to explain how the conclusion changes under different consumption or terms for selling surplus electricity.
Available roof space is only the starting point
A roof's suitability for the selected mounting system involves more than area. The US Department of Energy identifies structural strength, roof age, compatibility with the system and wind exposure as considerations. These are technical guidelines, not Croatian design regulations. [3, “Rooftop PV Systems”]
Request a roof assessment before accepting the final panel layout. Roof area alone does not establish structural condition or mounting suitability.
What does the existing grid connection allow?
Grid import capacity and export capacity are separate entries in HEP ODS documentation. The application for an EOTRP, the study of the optimal technical grid-connection solution, also distinguishes installed capacity from connection capacity. [4, p. 2]
This form is not a general application for every solar installation. HEP ODS specifies its use for complex connections that do not require an energy authorisation (energetsko odobrenje), generally for connection capacities above 500 kW. The separate application for grid-connection consent (elektroenergetska suglasnost, EES) also covers connecting a generating installation to an existing customer's electrical installation. [7, forms PM-1.1.1. and PM-1.2.1.]
Identify the procedure applicable to the specific project and verify the planned export capacity in the relevant documentation. A generation estimate alone does not establish connection conditions.
What is exported electricity worth?
According to HEP Opskrba, a customer with own generation uses the installation for its own needs and exports surplus electricity to the grid. The purchase of that electricity is governed by a supply contract for a customer with own generation. [5]
The value of surplus in a project assessment should therefore reflect the specific terms for selling surplus electricity. Show the value of electricity used directly and revenue from exports separately, with the contractual assumptions identified.
Annual bill savings are not the full investment result
The value of generation is first assessed by comparing the electricity bill with the system against the bill without it. This is the method described in the SAM documentation: the difference represents bill savings, while the calculation may include energy, fixed and demand charges, together with compensation for exports. [11, introduction and Monthly Data]
The next question is whether that benefit justifies the investment and operating costs. Net present value (NPV) expresses future cash flows in today's money. In SAM's definition, a positive NPV means that the value of bill savings exceeds the system's cost over the analysis period. [11, Summary]
Using the same consumption and analysis period, show how each feasible capacity changes the electricity bill, initial investment and operating costs. Assess the additional investment required for expansion separately. Higher annual savings alone do not establish whether a larger system delivers a better financial result.
Billing for a Croatian project must reflect its tariff model and contracts. The SAM description provides a methodological reference.
Export limits also influence system sizing
Research published in Energies shows that a maximum export power limit can change energy flows, economic performance and sizing results. The paper analyses an Italian household; its numerical results should not be transferred to a business facility. [9, abstract and section 3.5]
When preparing an investment decision, request a model that accounts for permitted exports and separately shows any curtailed generation. If a battery is considered, the comparison should include its investment, costs and operating strategy. The presence of surplus alone is insufficient grounds for recommending additional equipment.
What should accompany a proposal?
The following checklist is our recommendation for preparing the decision, based on the sources cited:
- Consumption data and an explanation of how accurately they represent business operations.
- A generation estimate stating the location, inputs and method.
- A comparison of feasible sizes using the same assumptions.
- Energy flows separating on-site use from exports.
- A technical basis covering the roof and applicable connection procedure.
- A financial assessment stating the investment scope, operating costs and terms for selling surplus electricity.
Which size is right for your business?
The recommended capacity should follow from a comparison of generation, consumption, technical conditions and economics at the specific site. The proposal should explain the choice by comparing feasible options and stating the assumptions clearly.
A good proposal should help you understand why that capacity suits your business. This is the foundation for a decision that can be checked and compared with other solutions.
Let's discuss your project
Share your project location, available consumption data and investment objective.
Contact us →Sources and technical references
Technical statements are linked to sources alongside the relevant paragraphs. Practical steps and supplier questions are an editorial synthesis of the cited methods, rather than quotations. The 2016 IEA PVPS report is used for technical definitions; US sources support methodology and engineering principles. They do not interpret current Croatian regulations or market prices.
- European Commission, JRC: PVGIS 5 user manual. Sections 4.1, 4.2 and 9.
- IEA PVPS: Review and Analysis of PV Self-Consumption Policies, T1-28:2016. Printed pages 4, 5 and 7.
- US Department of Energy: Life Cycle of Photovoltaic Systems. Rooftop PV Systems section.
- HEP ODS: Application for an EOTRP, PM-1.1.1. (Croatian). Version 0.4, page 2.
- HEP Opskrba: Customer with own generation (Croatian).
- HEP ODS: Access to business metering data (Croatian).
- HEP ODS: Grid-connection forms and documents (Croatian). PM-1.1.1. and PM-1.2.1.
- National Laboratory of the Rockies: REopt Capabilities. Inputs, system sizes and economic outputs.
- Self-Consumption and Self-Sufficiency in Photovoltaic Systems: Effect of Grid Limitation and Storage Installation. Energies 14(6), 1591, 2021. Section 2.1, equations 1 and 2.
- Krah, K.; Elgqvist, E.: Economics of Solar with Storage for Municipal Buildings in the City of Orlando. NREL/PR-6A20-75271, November 2019. Inputs: p. 6; direct purchase without batteries: p. 22; assumptions and limitations: pp. 2, 4 and 12.
- System Advisor Model (SAM): Electricity Bill Results. Introduction, Summary and Monthly Data.