LFP or NMC: how to choose a battery system for your business?
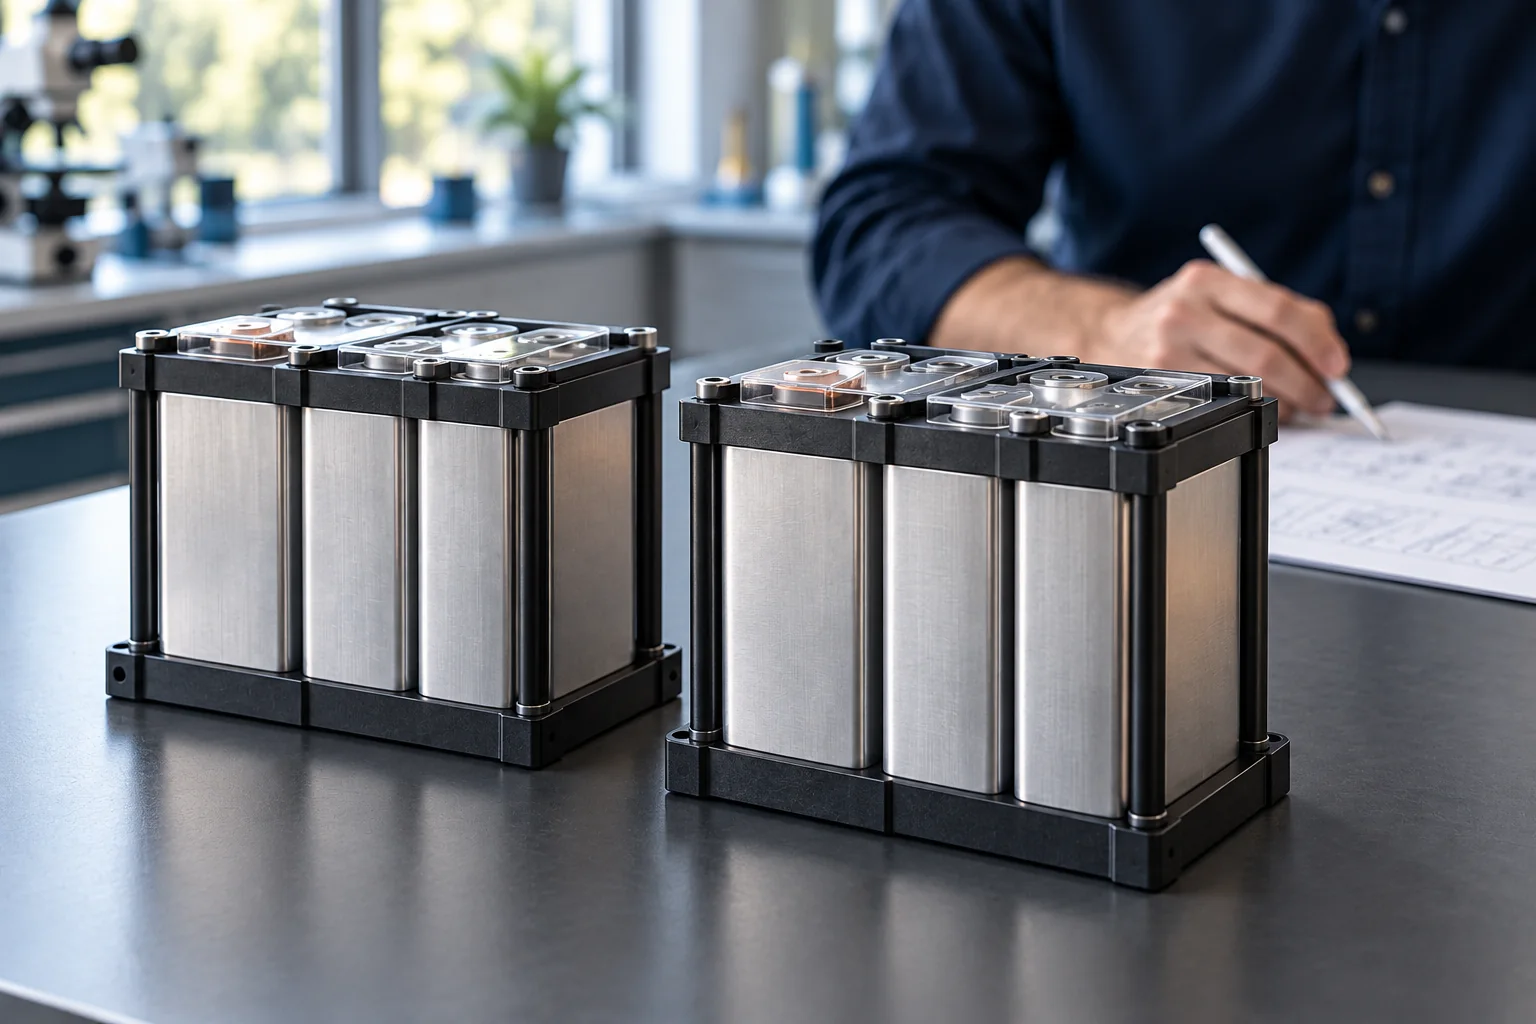
Two quotes for a 200 kWh battery are on your desk. One is cheaper; the other is more compact. But can each reduce electricity purchases during the later shift, and still do so in eight years? Using an illustrative industrial facility, we explain how to compare LFP and NMC and identify the differences that affect operation, risk and investment cost.
Define the task before choosing the technology
Consider a company with a solar power system and production continuing into a later shift. On the day we examine, the solar system generates 500 kWh. The facility directly consumes 350 kWh, leaving a surplus of 150 kWh. Later, it wants to reduce grid imports by 60 kW for two hours, requiring 120 kWh of delivered energy.
- 150 kWh solar surplus available for charging that day
- 60 kW target reduction in grid imports
- 2 hours required duration, needing 120 kWh
This is the starting point for a useful specification: when energy is available, when it is needed and the power at which it must be delivered. We assume the facility consumes at least 60 kW during that period and that site conditions allow the intended operation. The figures are illustrative; one day is insufficient for sizing a system for year-round use.
Now the LFP–NMC comparison has a purpose. We need a system that can perform this task regularly, fit the site and retain sufficient capability throughout the intended operating period.
LFP and NMC: what matters to your facility?
Both are lithium-ion battery technologies. They differ in their cathode material, which influences energy density, thermal behaviour and service life.
LFP: a strong candidate for frequent use
LFP uses lithium iron phosphate. It generally offers favourable thermal stability and cycle life. Its cathode does not contain nickel or cobalt. In our example, where the battery regularly charges from solar surplus and discharges during the later shift, these characteristics are good reasons to shortlist LFP.
NMC: more energy per unit of mass or volume
NMC uses lithium nickel manganese cobalt oxides in varying proportions. Its typical advantage is higher energy density. Where space or permissible equipment weight is tightly constrained, that can make a project easier to deliver.
These are general characteristics; individual cells and systems can differ considerably. The DOE energy storage safety review explains LFP’s advantages and the limitations of both chemistries. Chemistry is therefore an initial selection criterion; the product specification and documentation establish what you are buying.
When does a compact battery add value?
For our company, the decision changes depending on whether there is ample space beside the facility or only a small equipment room. In the first case, smaller dimensions may add little value. In the second, they may determine whether the project is feasible.
Compare the footprint of the complete installation: battery, inverter, cooling, protection, required clearances and maintenance access. Higher cell energy density can help, but the layout of the actual equipment must demonstrate the benefit.
Compactness has business value when it resolves a real site constraint. Where space is available, service life, support and operating cost may matter more.
Two 200 kWh batteries, two different results
Let us return to the quotes. Both state a nominal capacity of 200 kWh. In this simplified example, their continuous output power differs.
| Parameter | System A | System B |
|---|---|---|
| Nominal capacity | 200 kWh | 200 kWh |
| Assumed usable fraction | 90% | 90% |
| Energy within the operating window, before discharge losses | 180 kWh | 180 kWh |
| Continuous AC output power | 70 kW | 40 kW |
| Can it deliver the required 60 kW? | Yes, on the assumed power rating | No; it can meet part of the requirement |
The implication for the later shift is concrete: even at its full 40 kW, System B leaves at least 20 kW of the planned reduction unmet. Over two hours, that means at least 40 kWh of additional grid imports relative to the target. Production can continue if the grid supplies the requirement, but the battery does not deliver the intended result.
Systems A and B are illustrative and do not represent particular chemistries. Both LFP and NMC systems can be designed for different power ratings.
Is there enough energy as well?
Assume a round-trip efficiency of 90%, measured from AC input to AC output. If all 150 kWh of solar surplus is supplied to the system and the battery returns to its initial state of charge after discharge, it would deliver 135 kWh. That is 15 kWh more than the required 120 kWh. We assume this efficiency includes auxiliary consumption during the cycle.
System A therefore passes the initial power and energy check in this example. A real project must still confirm the available operating window, initial state of charge, auxiliary consumption, temperature and control limits. The additional 15 kWh is not automatically an adequate design margin.
Charging also needs checking: can the system accept 150 kWh during the period when surplus occurs? Sufficient daily surplus does not guarantee that its instantaneous power matches the battery’s charging capability.
kW describes how much power the battery can deliver. kWh describes the energy available. Request both figures on a clearly defined measurement basis.
Will the battery do the same job in eight years?
A battery loses some capacity over its service life. Assess the investment against its capability in later years, when the equipment has already been paid for but the facility still expects the same service.
Temperature, depth of discharge and charging and discharging rates matter alongside frequency of use. Depth of discharge, or DoD, describes the fraction of capacity used during discharge. Batteries also age while idle, known as calendar ageing. Tests of commercial LFP and NMC cells show why service life must be assessed under specific operating conditions.
What does 80% remaining capacity mean?
If the battery in our example retained 80% of its initial nominal capacity, it would have 160 kWh. At the same assumed usable fraction of 90%, the operating window would hold 144 kWh before discharge losses, compared with the initial 180 kWh.
Could it still deliver the required 120 kWh? That depends on discharge losses and available power. If it cannot, the company will cover more of its demand from the grid or consider an upgrade. Include this potential cost in the original assessment.
Technical note: round-trip efficiency covers charging and discharging; it cannot automatically be used as discharge efficiency alone.
Ask the supplier to assess performance at the end of your planned operating period and explain whether the assessment rests on warranty terms, testing or modelling. A high advertised cycle count is insufficient on its own.
A ten-year warranty: what is actually covered?
Read the warranty alongside the operating plan. In addition to years, it may specify energy throughput limits, cycle counts, minimum retained capacity and mandatory operating conditions. Check whether the first limit reached determines coverage.
In our example, 150 kWh supplied at the AC input delivers 135 kWh at the AC output over the complete cycle. For the following calculations, we assume the facility uses the remaining 15 kWh later, in addition to the 120 kWh needed during the specified two hours. Repeating this operation on 300 days per year would deliver 40.5 MWh annually.
135 kWh × 300 days = 40,500 kWh per year
If a warranty limit were 400 MWh, measured at that output, it would be reached in approximately 9.9 years at an unchanged annual delivery.
The limit is hypothetical and serves to explain the method. A manufacturer may measure energy on the battery side or use another definition. Actual solar surplus, degradation and operating schedules also change annual throughput.
How quickly support can restore operation matters too. While the battery is unavailable, its contribution to savings is lost; consequences may be greater if it supports a critical process. Check response times, labour and transport costs, and the procedure when capacity falls below the agreed value.
What evidence of safety should you request?
LFP’s favourable thermal stability is a useful advantage, but safety requires assessment of the complete installation. LFP systems can also experience serious incidents. The DOE safety review cautions that changing chemistry alone does not remove every risk.
For our facility, this means requesting documented answers to three questions: how an abnormal condition is detected, how the system responds, and what the site must provide for safe installation and intervention.
The battery management system, or BMS, monitors cells and manages protective functions. Cooling, electrical protection, alarms and shutdown arrangements also need checking. Test documentation must state whether it covers a cell, module or the proposed system.
Location, maintenance access and fire protection measures must align with the design and site requirements. The supplier should clearly identify the requirements the customer must fulfil.
What is one day of storage worth?
Our facility makes productive use of all 135 kWh returned by the battery, including the additional 15 kWh after the two-hour period. Assume each kWh avoids an electricity purchase worth €0.18. Also assume the 150 kWh surplus could otherwise have been exported at €0.06/kWh. Both amounts are on the same tax basis, excluding VAT.
Avoided purchases: 135 kWh × €0.18 = €24.30
Forgone export revenue: 150 kWh × €0.06 = €9.00
Difference for the day: €15.30, before other costs.
At 300 identical operating days, the difference would be €4,590 annually. This is neither net profit nor a payback calculation: investment, maintenance, financing, degradation and possible replacements still need accounting for. Add auxiliary consumption if it is not already included in the assumed efficiency.
If only 120 kWh is usefully consumed and the additional 15 kWh has no economic value, with the same 150 kWh charging input the difference falls to €12.60 per cycle, or €3,780 for 300 such cycles. Energy retained for future use must be tracked over a longer period, rather than counted as a saving already realised.
Prices are calculation assumptions, and 300 identical days is a simplification. At just 200 such days, the difference falls to €3,060 annually. The equipment is unchanged; its utilisation changes. A real assessment must therefore include weekends, holidays and seasonal variation.
Calculation basis: interval generation and consumption data and contractual purchasing and export terms. Avoided purchase value includes only charges that actually decrease; fixed charges do not automatically disappear.
This calculation covers shifting solar energy to a later period only. Other benefits, such as reducing billed peak demand, require separate confirmation against the tariff and operating plan. They cannot simply be added if they compete for the same capacity at the same time.
Six questions that make quotes comparable
Give suppliers the same description of the task and request answers to these questions:
- Can the system deliver 60 kW for two hours? Request confirmation of continuous power and deliverable energy under the intended conditions.
- What will it deliver in later years? Distinguish estimated degradation from contractually guaranteed values.
- How are losses calculated? Compare the same measurement basis and clarify whether efficiency includes cooling and auxiliary equipment.
- What limits the warranty? Check years, throughput, cycles, operating conditions and intervention costs.
- What must the site provide? Request complete installation dimensions, service clearances and safety documentation.
- What does the total price include? Check design, inverter, protection, controls, installation works, commissioning and long-term support.
If backup power is also required, specify operation during a grid outage separately. It needs an appropriate system design and is not automatically provided by having a battery. Energy reserved for outages must be deducted from the capacity available for daily optimisation.
How to make a decision without guesswork
Our company can now explain its decision. System B does not achieve the requested 60 kW reduction. System A passes the initial check; selection depends on confirming long-term performance, safety design and total cost.
Compare quotes under both expected and less favourable conditions: fewer operating days, a smaller spread between purchasing and export prices, and reduced capacity. If benefits are sufficient only under the most favourable assumptions, consider a smaller system or another approach to managing consumption.
For regular stationary use, LFP is often a good initial candidate. NMC merits serious consideration where its energy density brings a tangible site benefit. A chemistry’s advantage matters to the extent that the proposed product and intended operation demonstrate it.
A good quote shows the service the battery will provide to your facility, for how long and at what total cost.
First step: collect the last 12 months of bills, available interval consumption and solar generation data, grid connection documentation and planned changes to the facility. Add a clear description of what the battery should achieve. Quotes can then be compared against the same task, with the decision grounded in the results your business needs.